WHAT DO WOODY GUTHRIE, SALMON, TOILET PAPER, AND DIGITAL HUMANITIES HAVE IN COMMON? A MUSIC HISTORIAN'S VIEW OF THE COLUMBIA RIVER
Kelly Bosworth, 2019–2020 HASTAC Scholar
What do Woody Guthrie, salmon, toilet paper, and digital humanities have in common?
Woody Guthrie, salmon, toilet paper, and digital humanities can all help us better understand the history and the future of the Columbia River watershed. I know – you were hoping for a hologram of a folk musician eating salmon fritters on the crapper. I would watch that, too, right after I finish the rest of Netflix. Thanks, COVID-19.
This is not as entertaining, but the story is more interesting than you might expect.
The Columbia River is a massive river in the Pacific Northwest. When it meets the Pacific Ocean, the river stretches four miles wide. The Columbia is not only beautiful, with its forested bluffs and wide vistas; it is a working river. A system of locks and dams provide a navigable inland waterway for trade and a vast irrigation system for agriculture. Hydroelectricity from the dams generates one of the cleanest and most affordable energy grids in the nation. [Cue smug smiles from farm-to-table coffeeshop hipsters in Portland and Seattle.]
Despite the benefits of these dam projects, they have come at high costs. My project hopes to make visible – and audible – these connections and tradeoffs.
WOODY GUTHRIE
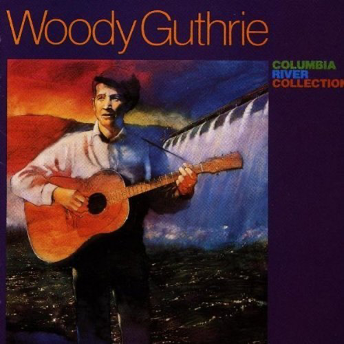
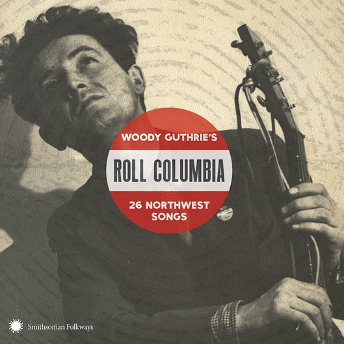
Woody Guthrie first saw the Columbia River in 1941. Woody would go on to be one of the most famous American folk musicians of all time, but in 1941, he was an unemployed father of three. The government offered him a job writing songs on the federal dime, and he jumped at the chance.
It was a strange project, somewhere between corporate advertising and government propaganda: Woody’s job was to write songs about the federal dam developments and lend his folksy air to these huge government projects. The goal was to convince regular people to see the benefit of the dams in irrigation, jobs, and electricity.
 |  |
Three of Guthrie’s songs were used in a 1949 film called The Columbia: America’s Greatest Power Stream. In the first minute, you can see the way that Guthrie’s down-home style contrasts with melodramatic string orchestra and a booming announcer voice who croons about the “wild and uncontrolled giant” whose “power roar[s] unharnessed to the Pacific.” [Note: this is the closest you will get to a Woody hologram, so take your chance and watch a minute or two.]
SALMON
Large-scale dams provided a great many things to the region. But the benefits and the costs have not been distributed equally; Native people have paid most dearly for the economic benefits of industrial river management.
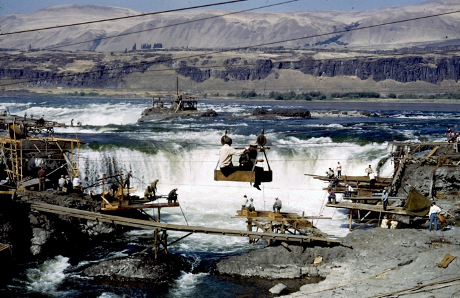
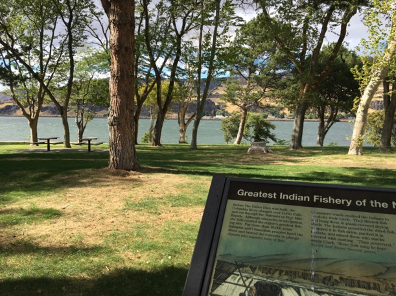
Before the first non-indigenous person floated the Columbia in the 18th century, the Columbia River Basin was already a densely networked region of rich resources. The area was – and still is – home to a diverse population of indigenous linguistic and cultural groups. For generations, the great waterfalls like Kettle Falls and Celilo Falls were cultural hubs for people all over the region. They were vital salmon fishing grounds and trading sites.
While Woody Guthrie was writing songs for Uncle Sam to support the dams, many Native residents were protesting the projects. They knew they would lose important aspects of their livelihoods and lifeways, especially their salmon fishing grounds on the great waterfalls.
 |  |
In a feat of engineering marvel repeated the world over, the great waterfalls of the Columbia went silent. While Woody Guthrie sang, “Grand Coulee is just about the greatest thing that man has ever done,” local leaders intoned funeral songs to Kettle Falls.
DIGITAL HUMANITIES
This is where digital humanities come in.
The more I looked at the Columbia River, the more I became aware of the need to understand and communicate these recurring connections and tradeoffs. In the humanities, we use words to analyze and share our findings. But I wanted people to be able to see and maybe even hear these connections. I needed some new tools.
Luckily, the HASTAC program was there to help. In consultation with the HASTAC staff, Indiana University librarians, other HASTAC Scholars, and faculty Fellows, I began to conceive of a way to create a digital humanities project that would allow people to visualize these connections across time and space.
My goal is to create an interactive map that users can manipulate through time and across space. The map will show how one dam project affects communities, species, and the landscape – not just up and down stream but forward in time. This visualization will help people to understand the tradeoffs we have made historically and are making presently around the health of our water system, our communities, and economic progress. These are questions that are vital to our moment, in which the larger tradeoffs between public health and economic disaster are at the top of the minds of policymakers and around the kitchen table.
Eventually, this map will be a public-facing feature of my larger dissertation project on the flooding of Vanport, Oregon, a town downstream of all of these dam projects.
As of now, the actual map feature feels far away. My mid-range goal is to continue to build my data set over the life of my dissertation research. I have begun the process of entering data points into a Google form, coding each event by theme tags, related dam project, location coordinates, evidence type, and source citation. I am working with archives across the country to find historic source maps that could be the base for my visualizations.
But let me tell you, I have had some issues with translating my humanities training into the digital humanities. Kelly, meet Data. You cannot charm your way into Data’s heart or use big words to cover up some fuzzy spots in your analysis. No, Data can see right through you.
It has been a challenge to figure out how to turn my qualitative, narrative, overlapping stories about the river into discrete data points that can be mapped and charted and spread-sheeted. Long before being able to use my new tool, I have to figure out how to make each event a discrete, mappable, time-bound phenomenon.
Oh, the irony! In order to show the connections across time and space, I first have to retreat and pretend that each thing is a discrete event. It feels like trying to win a marathon by lapping the rest of the globe.
But I will get there.
TOILET PAPER
You are always, at every moment of your life, in a watershed. Therefore, at every moment of your life, your actions affect the health of the entire system. It is a beautiful thing, really – we are all connected with the flush of a toilet. [Something to keep in mind if you are feeling lonely in this time of social distancing.]
As the current pandemic has only made more clear, we all need to better understand the importance of our individual actions to the health of the whole system. I hope that, through digital humanities, we can try to make our connections visible.

